Start Power BI Desktop
The Microsoft Power BI Desktop is an application for Windows 10, with which one can create evaluations of databases.
Various databases are connected via an interface and then graphic and tabular evaluations are created via the data.
The evaluations correspond to the Microsoft Office Charts, Diagrams and Pivot Tables.
What is the Power BI Desktop?
free desktop app for data evaluation.
Interfaces to SQL Server, MS Access, Excel and SQL and ODBC databases.
Costs:
The Power BI Desktop is free.
Hereby you can work well locally on a single place
The Power BI Pro costs € 8.40 per user per month and is unfortunately not part of Microsoft Office. In the Pro version, you can share data and manage access.
The Power BI reporting server costs at least $ 4,200 / node / month on a P1 node and is included with Power BI Premium
In this respect, the use of Power BI only makes sense locally, unless you can export the reporting to your own Reporting Web server.
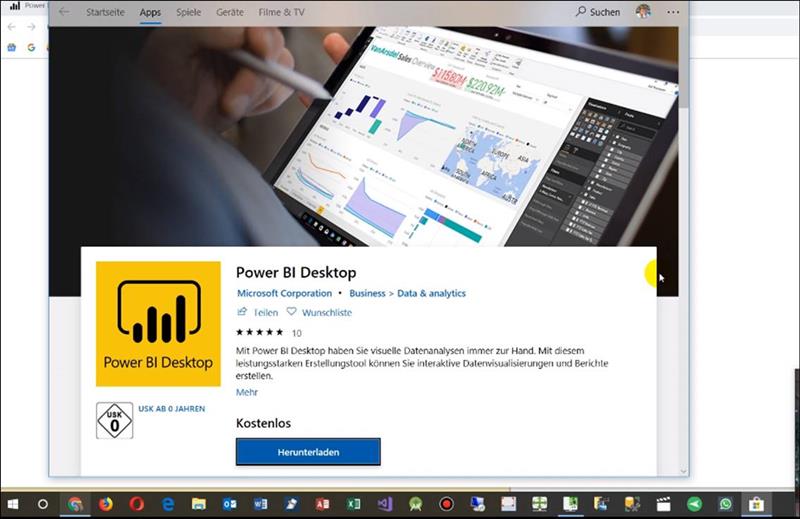
The installation of the free Power BI Desktop variant can be found at https://powerbi.microsoft.com/de-de/desktop/
The price information can be found at: https://powerbi.microsoft.com/de-de/pricing/

The Power BI desktop version is installed via Windows App from the Windows Store.
Power BI construction
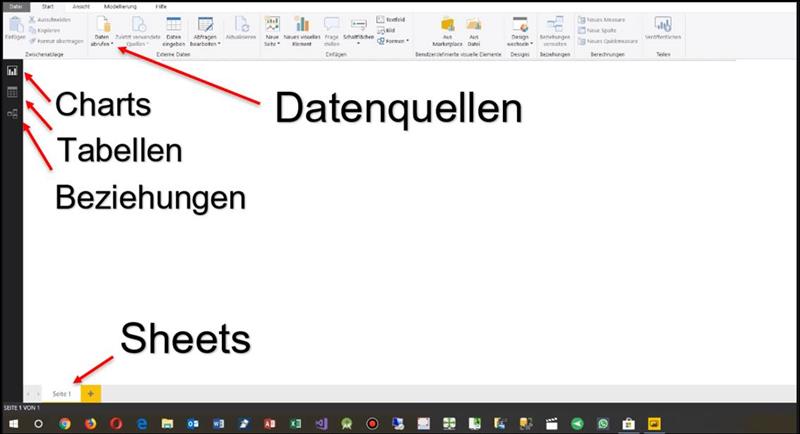
In the ground state you have under the Power BI desktop
Left:
· chars
· tables
· Relationships
Above: Retrieve data sources in data
Below: leaves
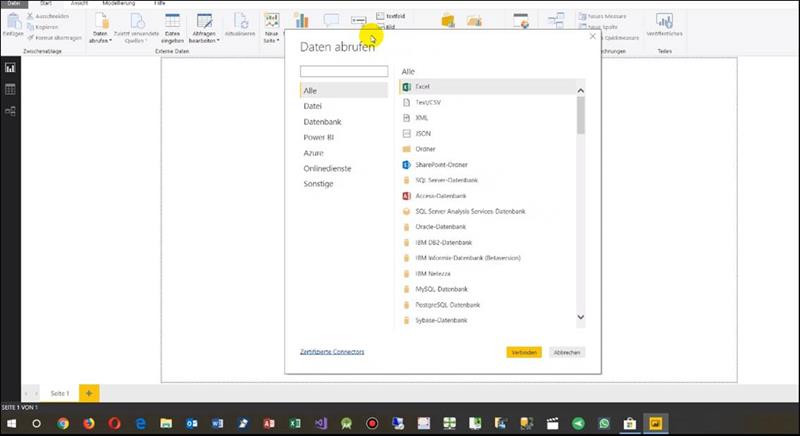
Connect data
The first step involves linking data from data sources.
Here you can connect Excel, Text, CSV, XML, JSON, SQL-Server Access and SQL / ODBC databases
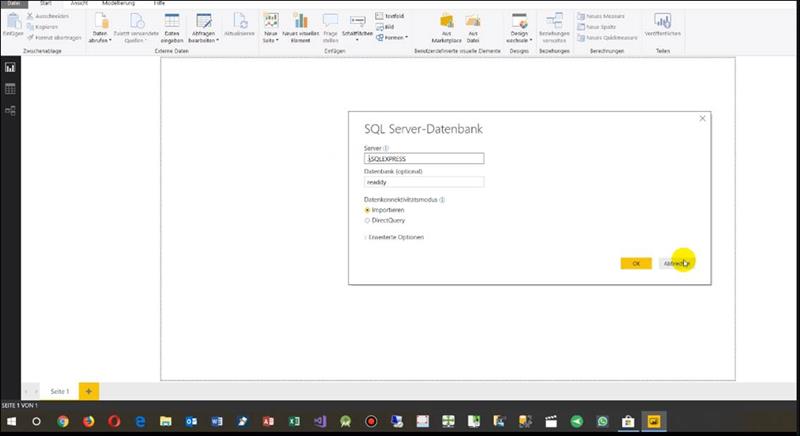
Connect to SQL Server.
When connecting the local SQL server, you enter.SQLExpress and the database to be connected.
As a data connection type, you should use DirectQuery to get real-time data from the server.
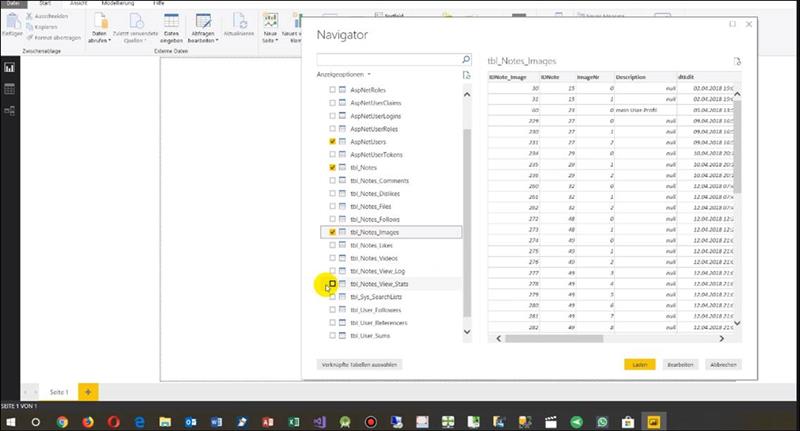
Select tables
Then you select the server tables and queries / views of the server.
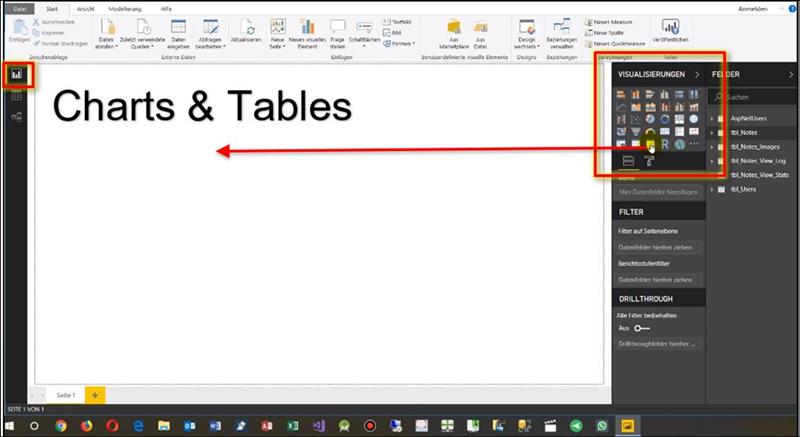
Represent data
Under the tool: VISUALIZATIONS you can select charts, tables, maps, pivots similar to Excel and drag them into the worksheet
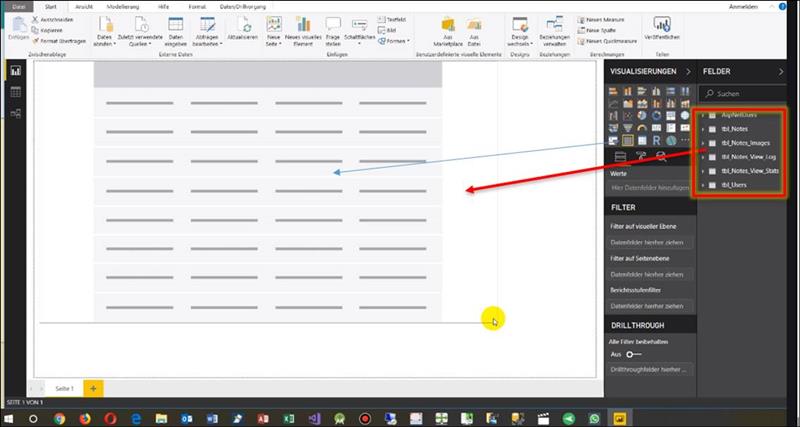
Draft Chart, Table
If you draw a table or graphic chart into the worksheet, you just have to select a table, which should be displayed /
Table Items
For simple tables, the data and fields that were selected under the Toolbar: FIELDS are displayed directly


 Users by Links
 Follow-Follower
 Log in
 Register


 CodeDocu_com


